Measuring Team Performance: Metrics Beyond Utilization

You measure team performance by the results a team reliably delivers: by lead time and on-time delivery as well as by quality and impact for the recipient. Utilization shows how busy a team is and says little about what actually arrives. Many companies nevertheless steer by hours and capacity ratios and find that full calendars go hand in hand with slow delivery. This article presents a measurement system with four dimensions, works out a sensible level of utilization and describes how leaders introduce the system in their teams.
Why is high utilization not a measure of performance?
High utilization is not a measure of performance because it only shows that time is occupied, and from around 80 percent waiting times rise so sharply that delivery slows down. Utilization describes the share of available time that is filled with work. In knowledge work the effort per task varies widely, and tasks depend on one another. Under these conditions high utilization acts as a brake: every disruption hits a team without a buffer and delays all ongoing work.
Queueing theory explains the mechanism. According to Little's Law (John D. C. Little, 1961), the following holds for a stable system: average lead time equals the amount of work in progress divided by throughput. Starting more work in parallel therefore lengthens the lead time of each item. Donald Reinertsen shows in “The Principles of Product Development Flow” (2009) that waiting times grow disproportionately as capacity approaches full use. Steering by utilization therefore rewards starting and delays finishing.
An example outside IT shows the effect. An inside sales team prepares quotes. At moderate utilization a quote reaches the customer after two days. If utilization rises because additional requests arrive without additional capacity, every request waits longer in the queue before anyone works on it. Processing time itself stays the same, lead time doubles, and some customers have meanwhile ordered from a competitor.
What is the optimal level of utilization?
For teams with fluctuating demand, a sensible planned utilization lies between 70 and 80 percent, and for teams with uniform, predictable tasks up to 85 percent. The remainder is a buffer for disruptions and urgent requests.
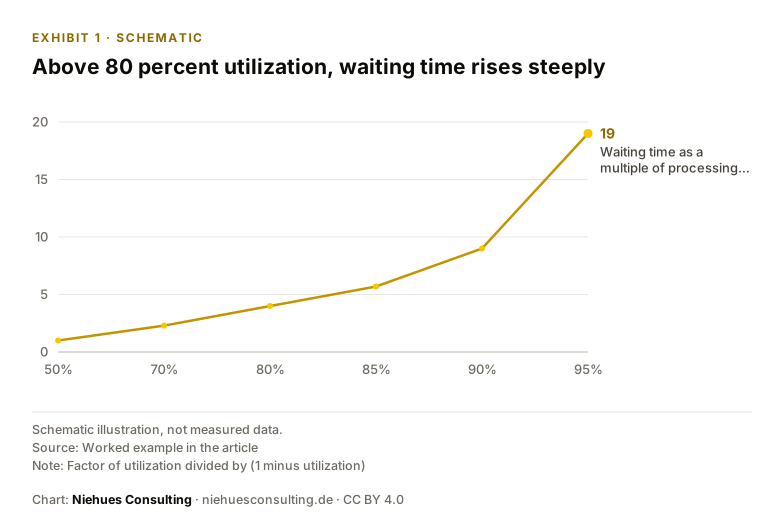
The calculation follows from the simplest queueing model with random arrivals and variable processing time. There, the average waiting time before processing equals utilization divided by free capacity, measured in multiples of processing time. The figures show why the last percentage point is so expensive.
Exhibit 1 · Schematic
Above 80 percent utilization, waiting time rises steeply
Source: Worked example in the article
Note: Factor of utilization divided by (1 minus utilization)
Real teams deviate from the model, but the direction stays the same. The more effort and arrivals fluctuate, the earlier the steep rise begins. The question “70 or 85 per cent?” is therefore answered by variability: a team whose work varies strongly in size and timing plans closer to 70 percent. A team with standardized tasks can afford 85 percent.
Which metrics are suitable for measuring team performance?
Suitable metrics are a few drawn from four dimensions, with every speed metric paired with a quality metric. A robust measurement system looks at these dimensions at the same time.
The dimensions follow established models. The team of authors around Nicole Forsgren shows in “Accelerate” (2018) that four metrics capture the delivery performance of software teams and that this delivery performance predicts the organization's commercial success. Speed and stability occur together in high-performing teams. The SPACE framework published by Forsgren's research team in 2021 recommends combining several dimensions of productivity: satisfaction and well-being, performance, activity, communication and collaboration, and efficiency and flow. Activity figures such as hours or tickets should never stand alone.
For team health, an internal study by Google on effective teams provides the most important pointer: psychological safety proved to be the strongest factor. The article Psychological safety and team performance describes its effect on results.
DORA metrics as a model
The DORA metrics come from research on software delivery. The classic four are deployment frequency, lead time for changes, change failure rate and failed deployment recovery time. The 2024 DORA report adds rework rate. The principle carries over to any team: two metrics measure speed, the others measure stability, and only both together show performance.
Distinguishing output from outcome
Output is the volume a team delivers, outcome the change that the delivery brings about for the recipient. An inside sales team delivers 120 quotes a month; that is output. How many of them become orders and how quickly customers decide is outcome. Above that sits the contribution to the business result, such as revenue or margin.
For steering, a clear sequence applies. Impact determines what counts, and delivery metrics show how the team gets there. A team measured only on output produces more, even if nobody uses it.
Four rules for using metrics
First, metrics apply to the team as a whole and are discussed within the team before they enter any reporting. A team that knows and interprets its figures improves itself. A team that experiences its figures only as control games them.
Second, metrics come in pairs. Lead time is viewed together with the rework rate, on-time delivery together with impact for the recipient. This makes a fast completion with a poor result visible immediately.
Third, the number of metrics stays small, at most five per team. Goodhart's Law goes back to the economist Charles Goodhart (1975) and in its common form states: when a measure becomes a target, it ceases to be a good measure. The fewer metrics a team tracks, the easier it remains to see whether genuine improvement lies behind them.
Fourth, the trend counts. A single measurement shows a position; only the development over several weeks shows whether a measure works.
Rollout in four steps
Rollout begins with the team's purpose: whom does it deliver to, and how does the recipient recognize success? The impact metrics follow from this. In the second step the team's value stream is sketched, from the arrival of a request to hand-over, including the points where work waits. That is where the lead times arise that can be measured later.
In the third step a baseline is collected over six to eight weeks without setting targets. Only then are target values realistic. In the fourth step a fixed cycle emerges in which the team looks at its figures, picks a cause and decides on a measure.
How Niehues Consulting makes team performance measurable
A measurement system takes effect when metrics fit a team's roles and decision paths. Niehues Consulting works on this from a delivery perspective. In delivery management, Niehues Consulting steers projects as delivery manager, project manager or product owner and establishes the metrics in ongoing operation. Organization design creates structures and roles in which a team can actually influence its results.
The approach follows the Niehues Delivery Model with the phases Understand, Build and Roll out. Three of its checkpoint questions matter for measuring team performance. Which business result should change measurably? What is the baseline, and how do we measure success? And which metric shows after 90 days that the change is landing? The article characteristics and metrics of a high-performing organization sets out the wider framework.
Founder Marin Niehues is a management consultant who builds organizations that deliver, in projects ranging from VC-funded scale-ups to DAX 40 corporations. A free initial consultation of 30 minutes clarifies where your teams should start.
Frequently asked questions
What are good metrics to measure team performance?
Good metrics are a few drawn from four dimensions: lead time and on-time delivery for delivery, rework rate for quality, use of the result for impact and surveys on collaboration for team health. Every speed metric is paired with a quality metric.
What are the DORA metrics?
The DORA metrics are measures from research on software delivery: deployment frequency, lead time for changes, change failure rate and failed deployment recovery time, complemented by rework rate. The principle of measuring speed and stability together carries over to other teams.
What is the optimal utilization rate, 70 or 85 percent?
Teams with fluctuating demand plan for 70 to 80 percent, teams with uniform tasks for up to 85 percent. At 85 percent, an item in the simplest queueing model already waits almost six times as long as its processing takes. The more the work fluctuates, the more buffer the team needs.
Is high utilization a sign of performance?
High utilization only shows that time is occupied. It says little about the result. As utilization approaches full capacity, waiting times rise disproportionately and delivery slows down.
What is the difference between output and outcome?
Output is the volume delivered, such as quotes prepared; outcome is the impact on the recipient, such as the order rate. Teams should be aligned on outcome and steered through delivery metrics. Measuring only output rewards volume over value.
How do you measure performance in knowledge work?
Knowledge work is measured by the flow of work and the impact of results. The measures are the time from arrival to hand-over, the frequency of rework and use by the recipient. These can be collected without time tracking.
What is the SPACE framework?
The SPACE framework is a model from research on developer productivity and covers five dimensions: satisfaction and well-being, performance, activity, communication and collaboration, and efficiency and flow. It recommends combining metrics from several dimensions. Activity figures alone are considered unsuitable.
Let’s talk about your initiative.
In 30 minutes we clarify where your organization stands and which step will pay off most now.
Request a consultation30 minutes · free · no obligation