Efficiency Programs: Cutting Costs While Protecting Performance
An efficiency program cuts costs while protecting performance when it starts from the value stream and tests every measure in advance for its effect on delivery. Across-the-board cut quotas produce quick savings. Without checking the effect on delivery, part of them returns as rework and delay. A program that steers cost and performance together first measures where value is created and where it stalls, and only then allocates the cost target to the levers.
This article describes the levers and the calculation of the savings target, along with duration, metrics and the reasons savings come back. How efficiency fits into organizational design as a whole is described in the article characteristics and metrics of a high-performing organization.
Why do quota-based cuts put performance at risk?
Quota-based cuts put performance at risk because every unit first cuts what is least noticeable in the short term, and that is often the capacity on which delivery depends. This means quality assurance and maintenance, time for work at interfaces and budgets for training. The effect shows with a delay. In the quarter of the measure, costs fall; after a few months, error rates rise, lead times lengthen and handovers between units become bottlenecks. The capacity saved returns as rework, often in the strongest teams, because they absorb the gaps.
A second mechanism amplifies the effect. Whoever is responsible for savings in their own unit has an incentive to shift costs into other budgets. Tasks move to neighbouring units, services are bought in externally, and the company's total costs remain unchanged.
Research supports this observation. A long-term study of large US companies found that firms which only cut headcount did not improve their profitability more than firms with a stable workforce. In an acute liquidity situation, the across-the-board quota remains an emergency instrument. A program meant to preserve performance starts from the question of which activities create value for customers and for delivery. Everything else is a candidate for simplification.
What levers does an efficiency program have?
An efficiency program has four levers: reducing complexity, removing bottlenecks, streamlining overhead, and reorganising procurement and external services. The levers differ in speed and risk, and the order in which they are used determines the effect.
- Reducing complexity: fewer variants and process steps reduce effort in many places at once. The risk to delivery is low; the risk to revenue is limited by a contribution margin calculation per variant before it is cut. The effect builds over several quarters.
- Removing bottlenecks: relieving the constraining point in the value stream raises throughput across the whole workflow. The measure lowers unit costs without cutting capacity.
- Streamlining overhead: reporting and committees, including approval loops, tie up time that customers miss. The effect is quick. The risk is low for committees that only inform, and high for committees that actually decide on resources.
- Reorganising procurement and external services: bundling and renegotiation reduce external costs. Beforehand, it is established which services are critical to delivery.
How bottlenecks can be found is described in Finding bottlenecks in value creation. The third lever is covered in detail in Reducing overhead without losing performance.
AI acts as an amplifier for levers two and three. Where review and reporting steps follow fixed criteria, it takes over the preparatory work and people handle the exceptions. The sequence stays the same: a step that can be dropped is removed before it is automated.
How much can an efficiency program save?
How much can be saved follows from the addressable cost base and the potential per lever measured in the diagnosis, which is why a robust target is only set after the diagnosis. A target set beforehand is a quota by another name. The calculation is simple and transparent for any executive team.
An example shows the calculation. A unit has total costs of 40 million euros, of which 25 million are addressable. The diagnosis shows a potential of two million euros for external services and 1.5 million euros for overhead. At an implementation rate of 70 percent, this gives around 2.5 million euros a year, or ten percent of the addressable base. The figures are a worked example. Your own target comes from your measured values.
Why savings come back and how to make them last
Savings come back when a program cuts costs and leaves the work unchanged. The work then finds new routes: positions are rebuilt through service providers, abolished approvals return as informal coordination, and with the next growth spurt costs rise again.
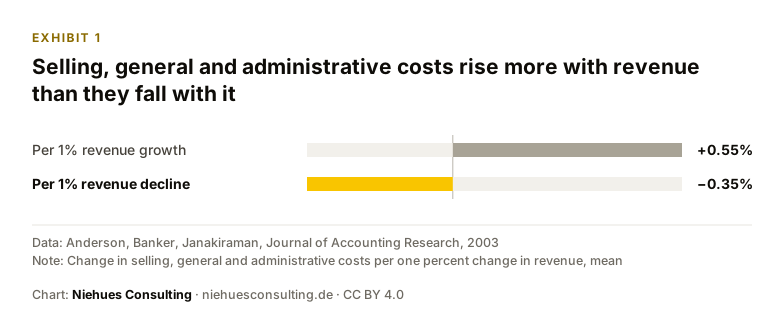
Research on cost behavior describes this pattern. A widely cited study showed that selling, general and administrative costs rise more when revenue grows than they fall when revenue declines. On average, they rose by 0.55 percent per one percent increase in revenue and fell by only 0.35 percent per one percent decrease. Costs do not adjust by themselves; they have to be reduced structurally.
Exhibit 1
Selling, general and administrative costs rise more with revenue than they fall with it
Note: Change in selling, general and administrative costs per one percent change in revenue, mean
A saving lasts when three things come together. The activity that caused it is dropped or reorganised. Roles and decision paths are adjusted so that it does not reappear. The counter-metrics continue in regular reporting beyond the end of the program.
How long does an efficiency program take?
An efficiency program typically runs for twelve to 24 months: diagnosis and portfolio of measures in eight to twelve weeks, first waves with impact within six months, structural embedding in the second year. Each phase ends with a decision by the executive team.
- Diagnosis: baseline values for delivery capability and cost structure are collected. Without this starting point, neither savings nor performance losses can be demonstrated later.
- Portfolio of measures: each measure receives its expected saving and its effect on delivery, together with an assessment of feasibility. The executive team selects from this portfolio.
- Implementation in waves: low-risk measures start first. Each wave closes with a review of the protective metrics.
- Embedding: roles and decision paths are adjusted so that the saving lasts.
A fixed stop rule has proven itself for steering. If a protective metric deteriorates beyond the agreed threshold, the program halts the affected wave and clarifies the cause before the next measure starts. This rule builds trust in the units, because it shows that performance is treated as equal to the cost target. Communication to the workforce starts just as early: the aim and approach are explained before the diagnosis, and results are reported per wave.
Metrics: the counterweight to the cost target
Every savings metric is paired with a counter-metric that makes the price of the saving visible. The pairing prevents a success on costs from masking a loss in delivery.
What matters for the program is that baseline values are collected before the first measure and evaluated at the same rhythm as cost reporting.
Niehues Consulting as a partner for efficiency programs
Niehues Consulting combines delivery management and organizational design: an experienced delivery manager steers the program, and roles and decision paths are designed so that the organization delivers reliably, in day-to-day business as in transformation. Founder Marin Niehues is a management consultant working from the delivery perspective who builds organizations that deliver. His projects range from VC-funded scale-ups to DAX 40 groups, he has worked in 20+ countries on six continents, and his home base is the DACH region.
The approach follows the Niehues Delivery Model with the phases Understand, Build and Roll out. Three of its review questions matter most for efficiency programs. In Understand: which business outcome should change measurably? Also in Understand: what is the baseline, and how do we measure success? In Build: which roles, decision paths and interfaces does operation require? The free 30-minute initial consultation clarifies which lever a program should start from and which protective metrics need to be defined: Request an initial consultation.
Frequently asked questions
How do you cut costs without hurting performance?
Costs fall without a loss of performance when the program targets activities that create no value for customers or delivery, and tests every measure for its effect in advance. Complexity and bottlenecks, as well as overhead and external services, offer the most productive starting points. Protective metrics show early when a measure affects delivery.
Where do you start with an efficiency program?
The starting point is a diagnosis of value creation with baseline values for lead time, on-time delivery and quality. From this starting position comes a portfolio of measures, from which the executive team selects those with the best ratio of saving to risk.
How much can an efficiency program typically save?
The savings target follows from the addressable cost base and the measured potential per lever, weighted by the implementation rate. A robust target is therefore only set after the diagnosis. A target without a diagnosis is a quota by another name.
Why do cost reduction programs fail?
Cost reduction programs fail when they cut costs and leave the work unchanged. Costs then come back through service providers and informal coordination, or are shifted into other budgets. Savings last when they remove activities and adjust roles.
What distinguishes an efficiency program from a pure cost-cutting program?
A cost-cutting program targets the level of costs, while an efficiency program targets the ratio of cost to performance. It therefore measures both sides, ties savings to counter-metrics and changes the structure of work so that the saving lasts.
How long does an efficiency program take?
An efficiency program typically runs for twelve to 24 months. Diagnosis and portfolio of measures take eight to twelve weeks, first waves take effect within six months, and structural embedding follows in the second year.
What role does AI play in efficiency programs?
AI mainly amplifies the bottleneck and overhead levers by preparing review and reporting steps that follow fixed criteria. People handle the exceptions. A step that can be dropped is removed first and only then automated.
How do you communicate an efficiency program to employees?
Communication starts before the diagnosis with the aim and approach, including the stop rule for performance. After that, the program reports results and next steps for each wave. Managers in each unit explain the measures that affect their team.
Let’s talk about your initiative.
In 30 minutes we clarify where your organization stands and which step will pay off most now.
Request a consultation30 minutes · free · no obligation