Finding Bottlenecks in the Value Chain
A bottleneck in the value chain is the point that limits the throughput of the whole organization, and you find it where work piles up while downstream steps wait. Every improvement at that point raises the throughput of the whole. Improvements elsewhere do not raise throughput, even where they reduce cost locally. This article describes how a bottleneck analysis runs in two to four weeks, how to remove a bottleneck using the five steps of the Theory of Constraints and why the bottleneck also determines where AI pays off.
What is a bottleneck in the value chain?
A bottleneck, or constraint, is the step in a value chain with the lowest capacity relative to demand. A chain delivers at most what its slowest link allows. Eliyahu Goldratt described this insight in 1984, together with Jeff Cox, in the novel “The Goal” and went on to develop the Theory of Constraints from it. It applies to production lines as much as to bid processes and client projects. Work piles up in front of the bottleneck and is missing behind it. Every hour the bottleneck loses is an hour lost by the whole organization.
A second rule comes from Little's Law, which John Little proved in 1961. Average lead time equals work in progress divided by throughput. If the stock of work in front of a point grows, waiting time rises, even when everyone involved is fully occupied. For the executive team, this yields a test question: where is the largest stock of unfinished work while the downstream step is waiting? That is where the bottleneck sits.
How does a bottleneck analysis work?
A bottleneck analysis examines a value stream to identify the one point that limits throughput, and for a clearly bounded value stream it takes two to four weeks. For a value stream with up to five functions involved and digitally recorded cases, two weeks are sufficient. If more functions are involved or times have to be captured manually, it takes four. The approach follows four steps:
- Map the value stream. All steps from order intake to handover to the customer are captured with the roles involved. The basis is real cases from recent weeks, traced in sequence. Value stream mapping comes from lean management, and Mike Rother and John Shook set it out as a tool in 1998. How a value-stream-oriented organization is set up is covered in a separate article.
- Measure times and stocks. For each step, processing time, waiting time and the number of waiting cases are recorded. A sample of 20 to 30 real cases is enough for a first reliable picture.
- Identify the bottleneck. The bottleneck lies where the stock is largest and the downstream point demonstrably waits for work.
- Clarify the cause. Only now is the question asked why the point is limiting: because of capacity, because of decision rights or because of missing information.
The sequence protects against a common mistake. Many organizations start with solutions and collect improvement ideas across all functions. The value stream shows that most ideas target points where work already flows faster than it can be processed downstream. If you want to steer lead time, on-time delivery and quality on an ongoing basis, the metrics are set out in the article on managing delivery performance.
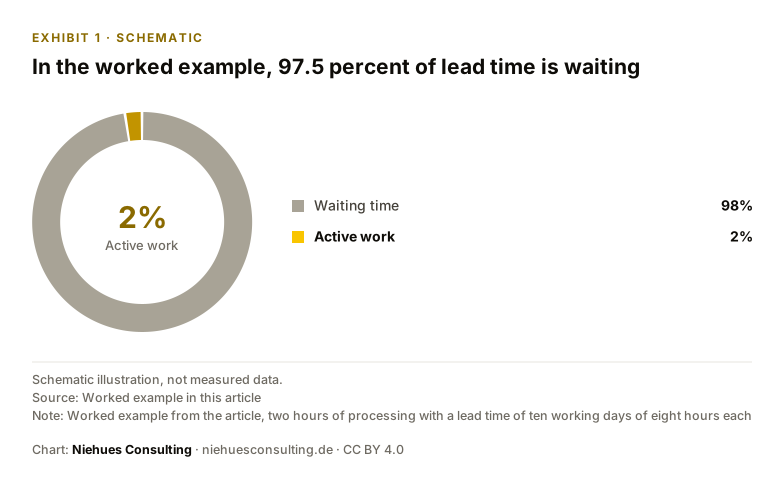
Exhibit 1 · Schematic
In the worked example, 97.5 percent of lead time is waiting
Source: Worked example in this article
Note: Worked example from the article, two hours of processing with a lead time of ten working days of eight hours each
Typical bottlenecks in knowledge work
In production and logistics, the bottleneck shows at the machine where material stacks up. In administration and sales, as well as in development and project business, cases stack up in inboxes and ticketing systems. There the bottleneck usually takes one of four forms:
- Approvals: cases wait for a decision that depends on one person or one committee. Decision rights are unclear or set too high.
- Interfaces: work is handed over between two functions, queries follow, then rework. The waiting time arises in the handover.
- Key people: specialist knowledge sits with one role that touches every case.
- System breaks: data is transferred manually from one system to the next.
Each form has its own lever. For approvals, clarifying decision rights helps, as covered in the article on decision speed. For interfaces, the organization changes the way teams are cut. For key people, spreading the knowledge provides relief. For system breaks, automation is the starting point.
How do you remove a bottleneck?
You remove a bottleneck in five fixed steps, which Goldratt described as the focusing steps of the Theory of Constraints. The sequence is binding because the inexpensive measures come before the costly ones:
- Identify: evidence the bottleneck with times and stocks, as described in the section on bottleneck analysis.
- Exploit: use the existing capacity of the bottleneck in full. It works only on cases that are fully prepared and loses no time on rework or on tasks that others can take on.
- Subordinate: every other point aligns its pace with the bottleneck. Upstream functions release only as much work as the bottleneck can process, so that no stock builds up.
- Elevate: only once the first three steps are exhausted does the organization invest in additional capacity, for example through staff or automation.
- Repeat: once the bottleneck is removed, the next point limits throughput. The search starts again.
The fifth step explains why the bottleneck search is a fixed rhythm. If approval set the pace, the next point limits performance once approval has been accelerated. With a stable order situation, a quarterly review is sufficient. After a reorganisation or a new system, the leadership team reviews again within four weeks.
Bottleneck first, then AI
The bottleneck also determines where AI is deployed. An application that saves time in a function with spare capacity barely changes throughput. The same application at the bottleneck raises the throughput of the entire value stream. Bottleneck analysis therefore provides the selection criterion: the benefit of an application is measured by whether it relieves the limiting point. In the five-step model, AI usually belongs to elevating, and sometimes already to exploiting, when it takes preparation and checking off the bottleneck. How use cases can be ranked by value and feasibility is shown in the article on prioritizing AI use cases.
Bottleneck analysis with Niehues Consulting
Niehues Consulting conducts bottleneck analysis as part of AI management and organization design and works according to the Niehues Delivery Model, with the phases Understand, Build and Roll Out. In Understand, business analysis maps the value stream and exposes the bottlenecks. Two test questions guide this phase: which business outcome should change measurably? What is the baseline, and how will success be measured? For a bottleneck analysis, these are throughput and lead time, measured before any change.
In Build, the business case assesses the relief of the limiting point, and prototypes prove the effect in the real process. In Roll Out, delivery management takes the solution into operations with clear responsibilities and decision paths. The test question there is: which metric shows after 90 days that the solution is landing? If throughput rises and lead time falls, the organization retains the gain. How organization design and delivery management work together overall is described in the article characteristics and metrics of a high-performing organization.
Founder Marin Niehues is a management consultant who works from the delivery perspective, as delivery manager, project manager or product owner, in projects ranging from VC-funded scale-ups to DAX 40 corporations. The entry point is a free initial consultation of 30 minutes. In it, the value stream is sketched with the first measurement points and the most likely bottleneck is narrowed down. You can request an appointment directly.
Frequently asked questions
How do I find the bottleneck in a process?
Map the value stream using real cases and measure the waiting time and the number of waiting cases at each step. The bottleneck lies at the point with the largest stock, behind which downstream steps are waiting for work.
What is a bottleneck analysis and how long does it take?
A bottleneck analysis uses measured times and stocks to identify the point that limits the throughput of a value stream. For a clearly bounded value stream it takes two to four weeks. The result is an evidenced bottleneck with its cause and the appropriate lever.
What is the Theory of Constraints?
The Theory of Constraints goes back to Eliyahu Goldratt and holds that the performance of a system is determined by a single limiting point. The method consists of five focusing steps: identify, exploit, subordinate, elevate and repeat.
What is the difference between lead time and processing time?
Lead time measures the entire time from a case's arrival to its completion, processing time only the time in which someone actively works on it. The difference is waiting time. In knowledge work, waiting time usually makes up the largest share of lead time, and it accumulates in front of the bottleneck.
How do bottlenecks in knowledge work differ from bottlenecks in production?
In production, the bottleneck is visible because material stacks up in front of a machine. In knowledge work, cases stack up in inboxes and tickets. The bottleneck is therefore measured through waiting times and stocks of cases, and its cause lies more often in decision rights and interfaces than in capacity.
How often should an organization review its bottlenecks?
At least quarterly. A removed bottleneck shifts the constraint to the next point, and changes in order intake and organization shift it further. After a reorganisation or a new system, the review belongs in the first four weeks.
Is the bottleneck always the most heavily utilized point?
No. High utilization only shows that a point is busy, and in knowledge work many points are fully utilized. The bottleneck shows itself through the stock of cases waiting in front of it and through downstream steps that are waiting for work.
Let’s talk about your initiative.
In 30 minutes we clarify where your organization stands and which step will pay off most now.
Request a consultation30 minutes · free · no obligation